The Inventory Shift Nobody Expected in Spring 2026
For the better part of three years, the dominant story in US residential real estate was inventory — specifically the lack of it. The lock-in effect from 3% pandemic-era mortgages had pinned existing homeowners in place, new construction was chasing demand but couldn't keep pace, and buyers with conventional financing were bidding against cash offers they couldn't touch. That narrative is genuinely changing in parts of the country, and the change isn't arriving uniformly. Understanding which markets have flipped — and which ones haven't — is the single most important piece of market intelligence for a buyer or investor entering the second half of 2026.
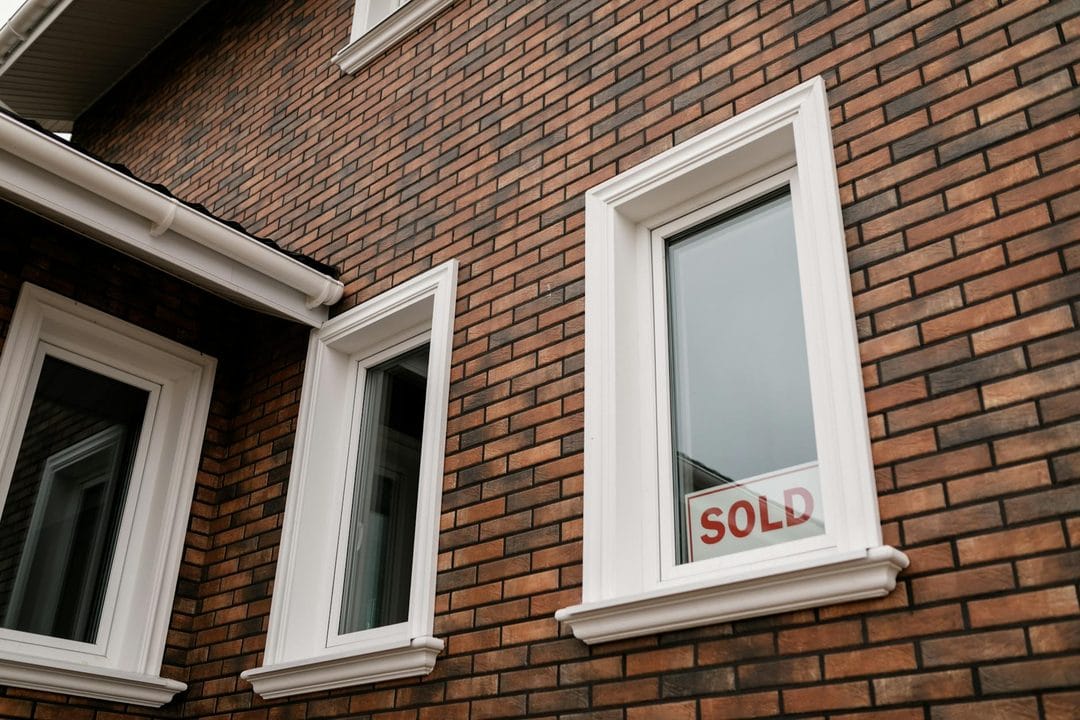
The national active listing count in early May 2026 stood at approximately 1.12 million units, up 22% from the same period in 2025 according to Realtor.com's weekly tracker. That's still below the pre-pandemic 2019 average of 1.7 million, but the trajectory is unmistakable. More listings means longer days on market, which means sellers competing for buyers rather than the reverse. What that looks like in practice: the all-cash-waive-everything offer culture that defined Austin, Tampa, and Charlotte in 2021–2022 is functionally over in those markets. Contingencies are back. Inspection periods are back. Sellers are paying concessions — and in some ZIP codes, they're offering to buy down mortgage rates to move inventory that's sitting past 60 days.
Where the Buyer Leverage Is Real Right Now
The clearest buyer's markets at the end of May 2026 are concentrated in two geographic clusters: the Texas interior (Austin, San Antonio, and the suburbs of Dallas that got overbuilt in 2022–2023), and the Florida Gulf Coast (Sarasota, Cape Coral, and Fort Myers). Both clusters share a common cause: they were the most aggressively overbuilt markets of the post-pandemic expansion, and both are now working through a correction that has inventory levels back above their 2019 baselines.
In Austin specifically, the downtown condo market is trading at 12–18% below peak 2022 prices in nominal terms — which translates to 22–28% below peak in real inflation-adjusted terms. A two-bedroom condo in the Domain corridor that sold for $620,000 in Q2 2022 is listing at $505,000–520,000 today, with active sellers offering 2–3% toward buyer closing costs or rate buydowns. For buyers who sat out the frenzy and have maintained their cash position, this is a structural reentry window, not a short-term dip. The correction in these markets is being driven by oversupply against demand, not by a spike in distressed sellers — which means prices are softening gradually and not collapsing, giving buyers time to negotiate without urgency.
The Florida Gulf Coast has a more complicated story. The insurance market for coastal Florida has deteriorated to the point where monthly carrying costs on homes in flood-zone-rated areas have increased $400–900/month compared to 2021 — not from mortgage rates, but from homeowners insurance premiums and flood insurance requirements. Citizens Insurance of Florida raised rates three times in the 18 months ending March 2026, and private market alternatives are either non-renewing or exiting the state. A buyer in Cape Coral needs to run the full carrying cost model, including insurance, before treating a listing price reduction as a genuine discount.
The Markets That Haven't Softened and Won't Anytime Soon
Midwest markets — Chicago suburbs, Columbus, Indianapolis, Kansas City — have not participated in the Sun Belt correction and show no signs of doing so. The underlying arithmetic is straightforward: these markets never experienced the same degree of speculative price inflation during the pandemic, their populations have remained stable without the overheated in-migration that fueled Sun Belt expansion, and their new construction pipelines are modest relative to demand. Indianapolis had a median days-on-market of 14 in April 2026. Columbus had 11. Kansas City suburban listings in the $280,000–350,000 range — the first-time buyer segment — routinely see multiple offers within a week of listing.
The Northeast coastal markets (Boston, greater New York, DC) are constrained by geography and zoning rather than demand, which makes them structurally different from overbuilt Sun Belt metros. These markets soften slowly and recover quickly because the supply side cannot respond to demand even when prices rise. A buyer in the DC suburbs or in the outer Boston commuter belt who has the cash and the pre-approval to move quickly is still, in May 2026, competing for a limited pool of listings. The rate environment hasn't meaningfully changed that picture.
What the 6.85% Rate Environment Means for Actual Buying Power
The 30-year fixed mortgage rate has traded in a band of 6.65%–7.10% since October 2025. The headline rate of around 6.85% in late May 2026 is not dramatically different from the 7.08% high of late 2023, but the psychology around rates has shifted — buyers are no longer holding out for a return to 5% or 6%, having watched that trade fail for two consecutive years. The "lock and list" strategy that mortgage brokers have been pitching since 2024 — lock a rate now with a float-down option, then refinance if rates drop — has become the operational standard for buyers who can make the numbers work at current rates.
The actual buying power calculation at 6.85% on a $450,000 purchase price with 20% down: a principal and interest payment of roughly $2,360/month, plus insurance and taxes depending on the market. That's $280–320/month more than the same purchase at 5.5% (the rate range of early 2023). It's a real carrying cost difference — over a five-year hold it adds up to $17,000–19,000 — but it doesn't make the purchase unworkable for a household income of $95,000+. The math changes significantly in the sub-$120,000 household income segment, which is why affordability metrics at the lower end of the market remain stressed even as mid-tier inventory builds.
The Builder Concession Landscape in June 2026
New construction is the segment where buyers have the most negotiating leverage right now, and most buyers aren't using it. Builders sitting on completed inventory — DR Horton, Lennar, and Meritage Homes are the three largest national players facing this position — are offering rate buydowns, closing cost contributions, and option upgrades at levels that would have been unthinkable in 2021. A 5.49% for the first two years on a 30-year loan (often structured as a 2-1 buydown, where the rate is 5.49% in year one and 6.49% in year two before settling at the market rate) is currently being advertised in DR Horton communities in Phoenix, San Antonio, and Jacksonville.
The question buyers should ask before accepting a builder's buydown offer: what's the underlying house price doing? Builders sometimes inflate base prices to fund the buydown concession, which means the subsidized rate comes packaged with an above-market purchase price. Getting an independent appraisal before contract on a builder home in a slow-moving community is worth the $500 fee — if the appraisal comes in 5–8% below the builder's asking price, you have either a negotiation lever or a clear signal to walk. The buydown is only a genuine concession if the house itself is priced at or below current market.
One Thing That Hasn't Changed
Whatever the rate environment, whatever the inventory level, whatever the negotiating leverage of the moment — the single thing that consistently separates buyers who get the deal they want from buyers who don't is pre-approval quality. Not pre-qualification, which is a two-minute credit check with no income verification. A full pre-approval with verified tax returns, verified employment, and a clear-to-close condition issued by an underwriter. In contested markets, sellers choose between two comparable offers based on who's more likely to close. In soft markets, a pre-approved buyer has leverage to negotiate that a pre-qualified buyer doesn't — because the seller's agent knows exactly how far the deal can be pushed before it falls through.